Network Monitoring
SNMP
Simple Network Management Protocol
- A database of data (MIB) — Management Information Base
- The database contains OIDs — Object Identifiers
- Poll devices over
udp/161
SNMP v1 — The original
- Structured tables, in-the-clear
SNMP v2c — A good step ahead
- Data type enhancements, bulk transfers, still in-the-clear
SNMP v3 — The new standard
- Message integrity, authentication, encryption
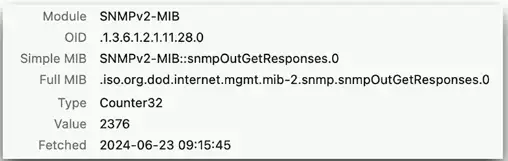
SNMP OIDs
An object identifier can be referenced by name or number
.iso(1).org(3).dod(6).internet(1).mgmt(2).mib-2(1).snmp(11).snmpOutGetResponses(28).0- .1.3.6.1.2.1.11.28.0
Every variable in the MID has a corresponding OID
- Some are common across devices
- Some manufacturers define their own object identifiers
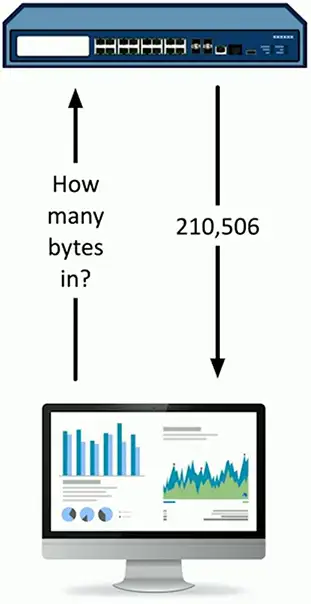
The SNMP manager requests information based on OID
- A consistent reference across devices
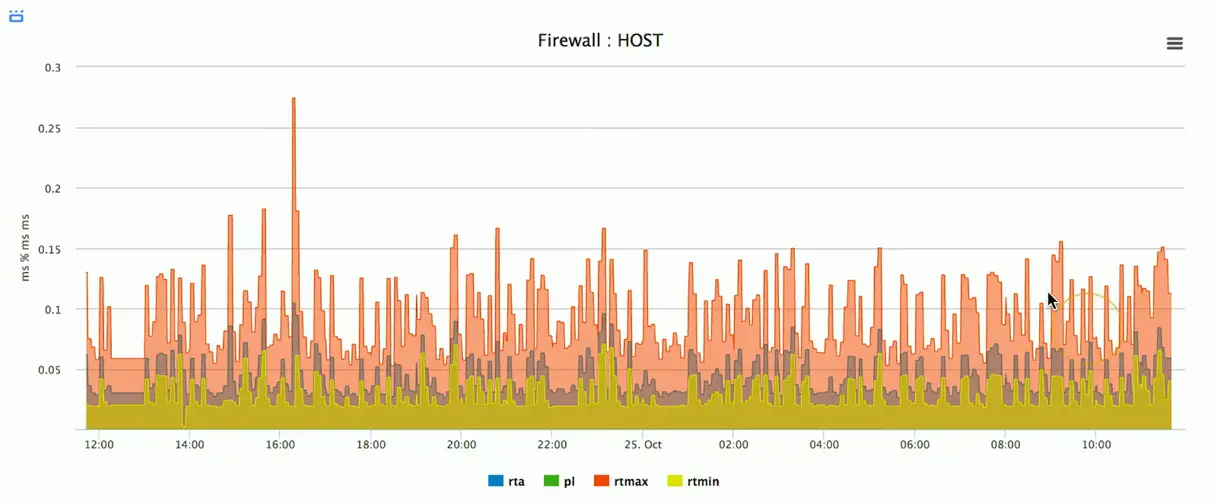
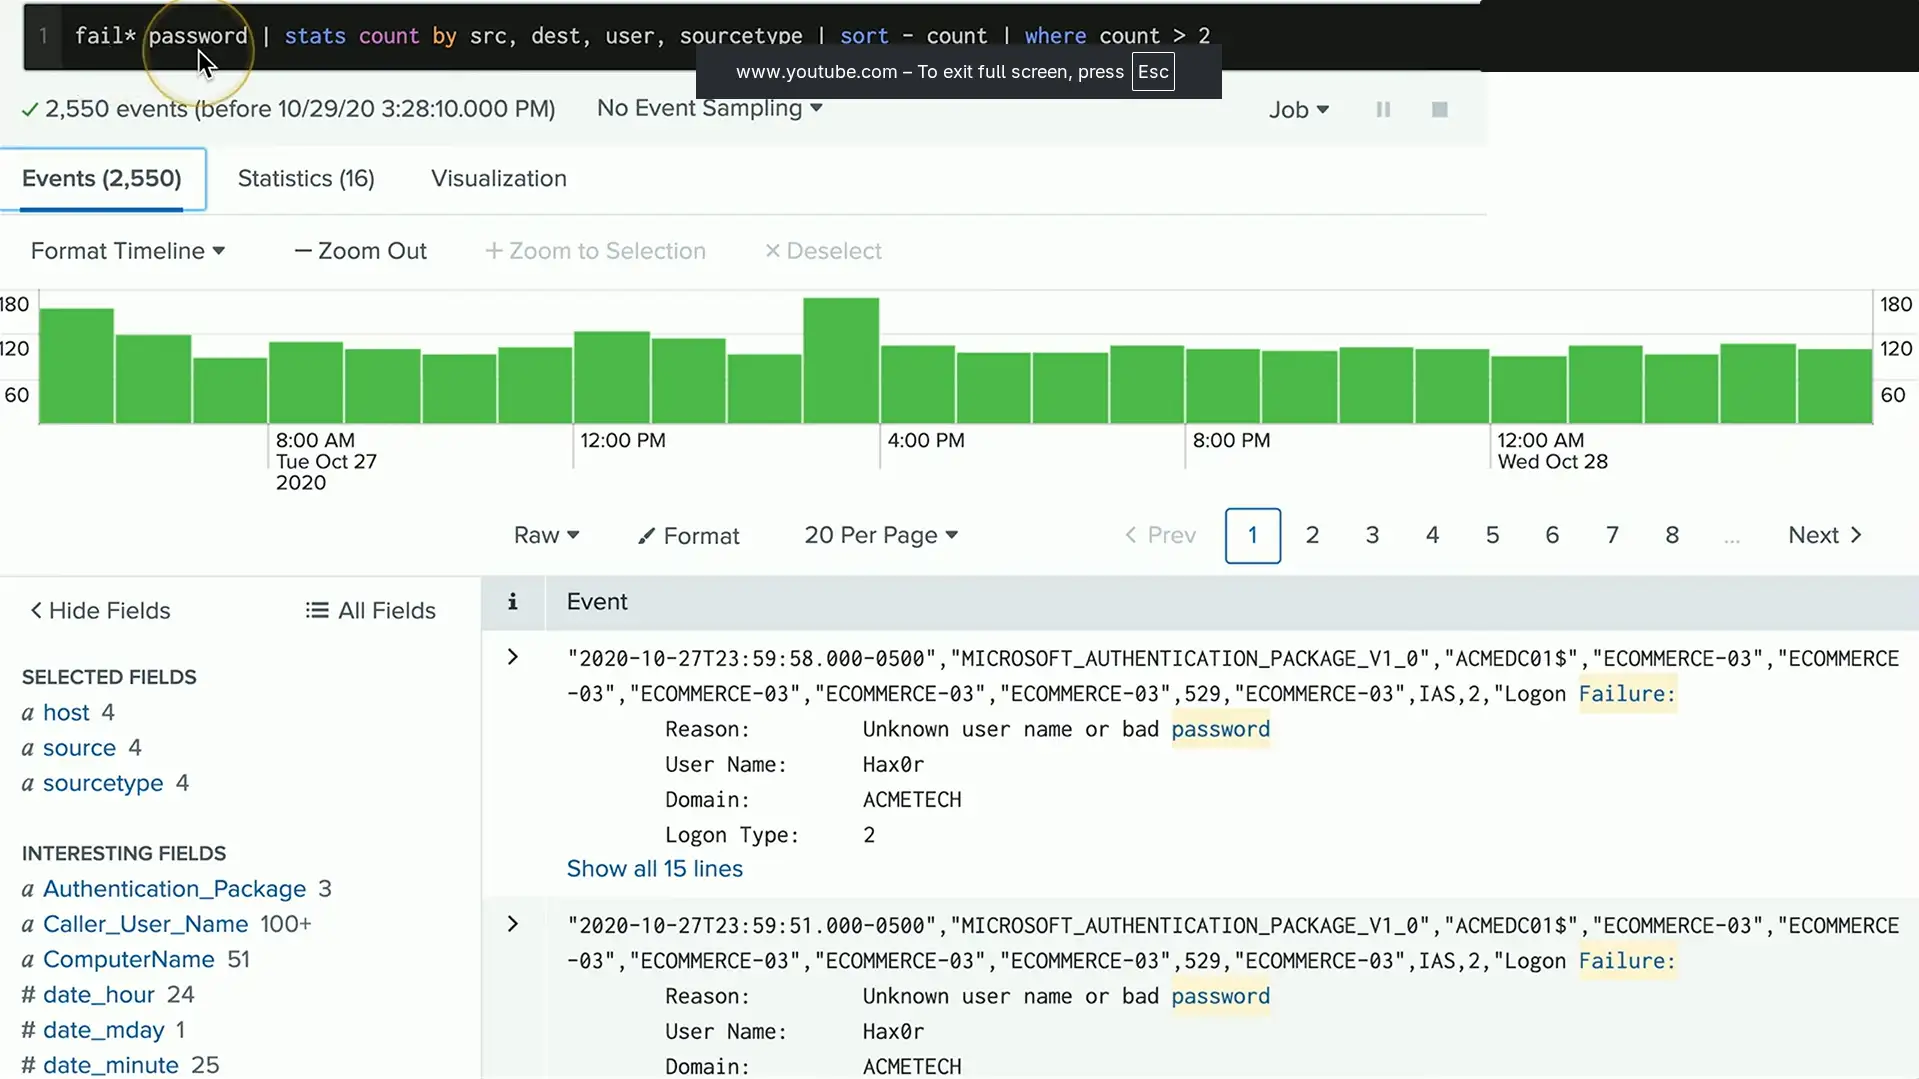
Graphing with SNMP
SNMP traps
Most SNMP operation expect a poll
- Devices then respond to the SNMP request
- This requires constant polling
SNMP traps can be configured on the monitored device
- Communicates over
udp/162
Set a threshold for alerts
- If the number of CRC errors increases by 5, send a trap
- Monitoring station can react immediately
Authentication
Community string
- A simple password-style authentication method
- Read-only, read-write, and trap
- Common community strings are public and private
- Used with SNMP v1 and SNMP v2c
Username and password
- Used in SNMP v3
- Transmitted as a password hash
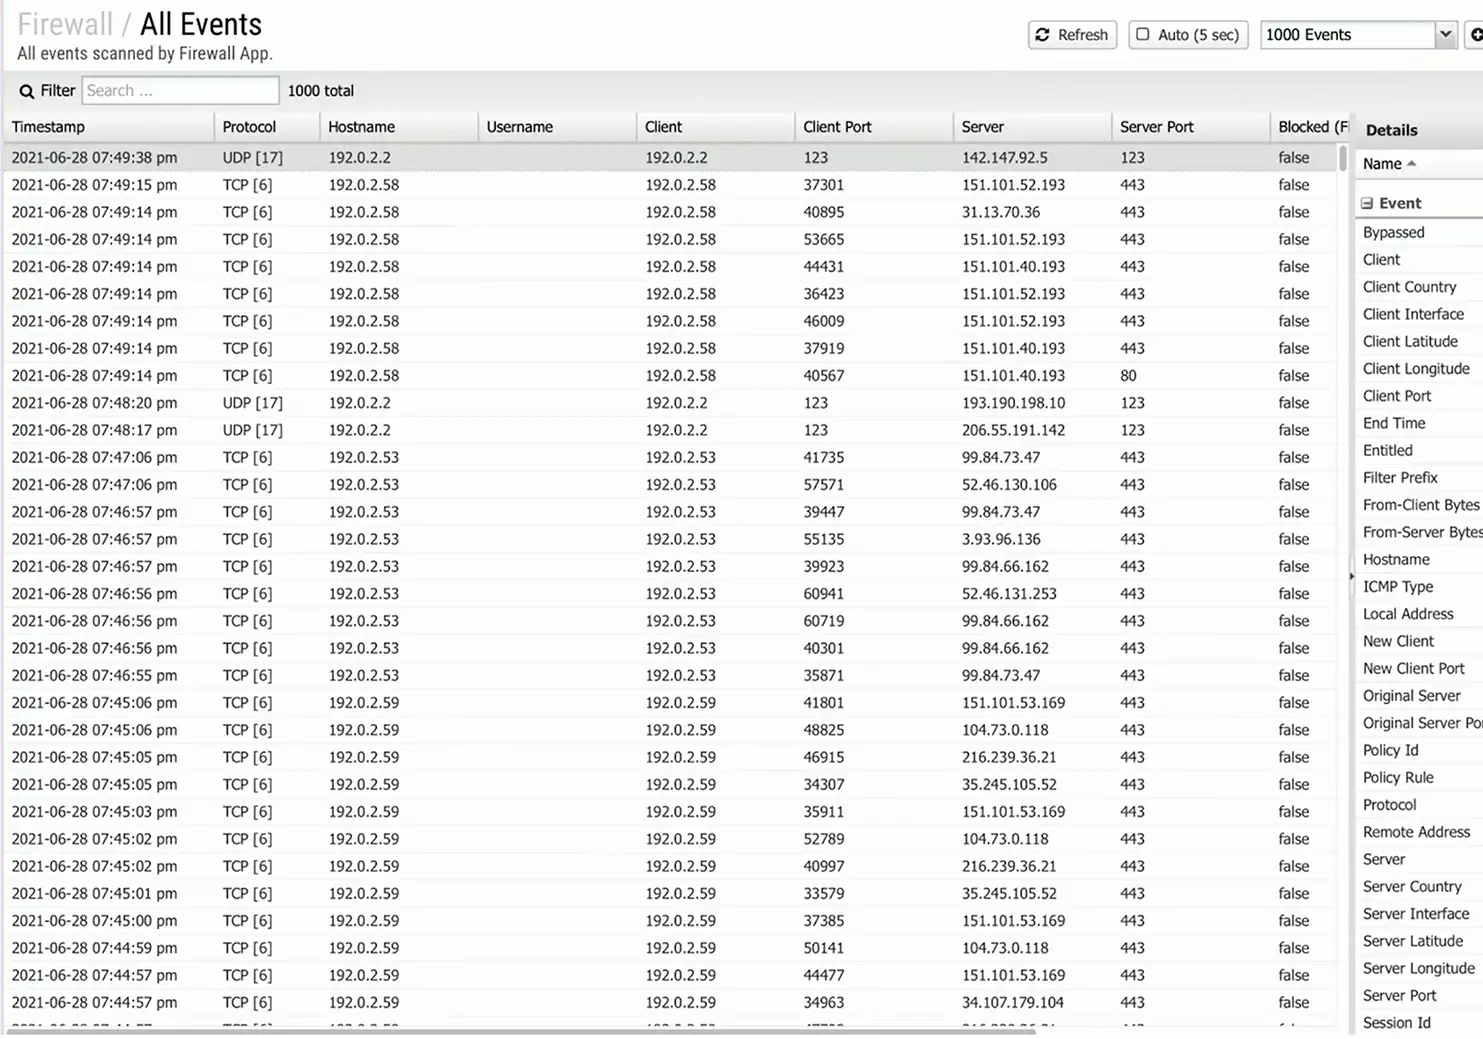
Logs and Monitoring
The network never sleeps
- 24/7/365
Monitor all important points
- Routers, switches, firewalls, services, remote access, authentication logs, etc.
React to events
- Account access, redundant devices, bandwidths
Status dashboards
- Get the status of all systems at a glance
Flow data
Gather traffic statistics from all traffic flows
- Shared communication between devices
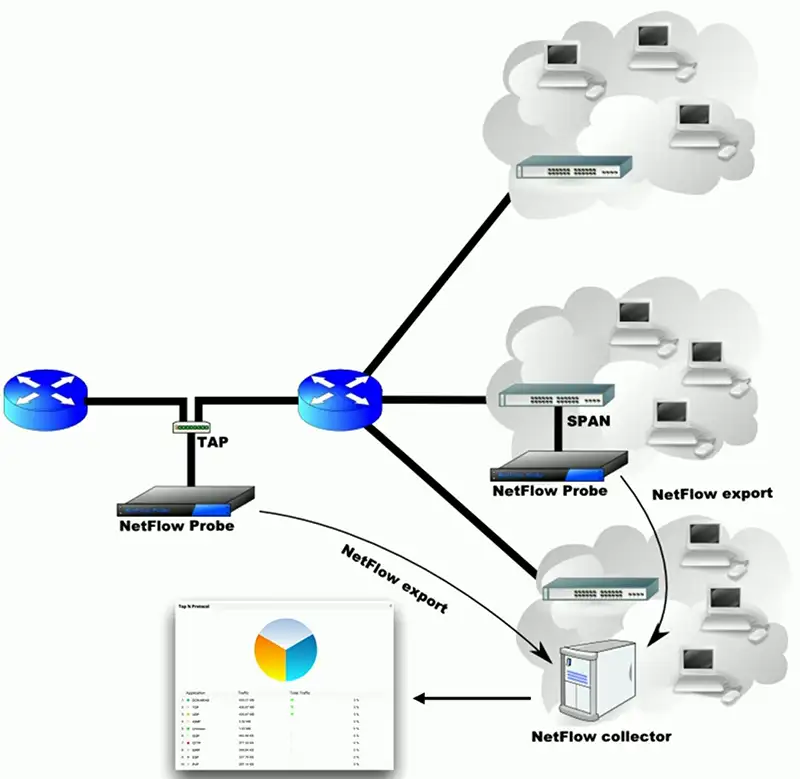
NetFlow
- Standard collection method
- Many products and options
Probe and collector
- Probe watches network communication
- Summary records are sent to the collector
Usually a separate reporting app
- Closely tied to the collector
Protocol Analyzers
Solve complex application issues
- Get into the details
Gathers frames on the network
- Or in the air
- Sometimes built into the device
View traffic patterns
- Identify unknown traffic
- Verify packet filtering and security controls
Large scale storage
- Big data analytics
Network Performance Baseline
Troubleshooting starts with a blank slate
- A baseline can add context
Intermittent or all-day issues
- Check utilization, individual device performance, etc.
Some organizations already collect this data
- Check the SIEM or management console
Look for patterns and correlation
- Alarm and alert when anomalies occur
Syslog
Standard for message logging
- Diverse systems create a consolidated log
Usually a central logging collector
- Integrated into the SIEM (Security Information and Event Manager)
Each log entry is labeled
- Facility code (program that created the log) and severity level
Common with most devices
- Firewalls, switches, routers, servers, etc.
SIEM
Security Information and Event Management
- Logging of security events and information
Security alerts
- Real-time information
Logging aggregation and long-term storage
- Usually includes advanced reporting features
Data correlation
- Link diverse data types
Forensic analysis
- Gather details after an event
Getting the data
Sensors and logs
- Data is sent to the SIEM using syslog
- OSes
- Infrastructure devices
- NetFlow sensors
Sensitivity settings
- Easy to be overwhelmed with data
- Some information is unnecessary
- Information, Warning, Urgent
API integration
Control and manage devices
- Hundreds of firewalls, routers, switches, and servers
- Log in to each device and make changes manually
Automate the command line
- Bath processes
- Very little control or error handling
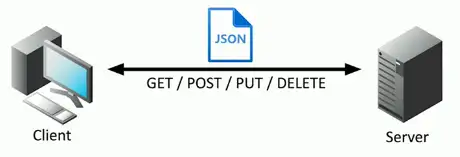
Application programming interfaces (APIs)
- Interact with third-party devices and services
- Cloud services, firewalls, OSes
- Talk their language
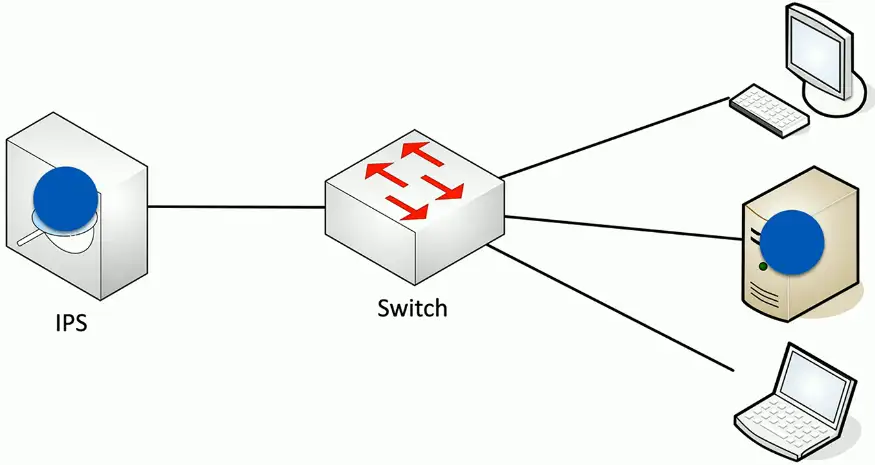
Port mirroring
Copy traffic from one or more interfaces
- Used for packet captures, IDS, performance monitoring
- Mirror traffic on the same switch
Mirror traffic from one switch to another
- Gather data from a remote switch
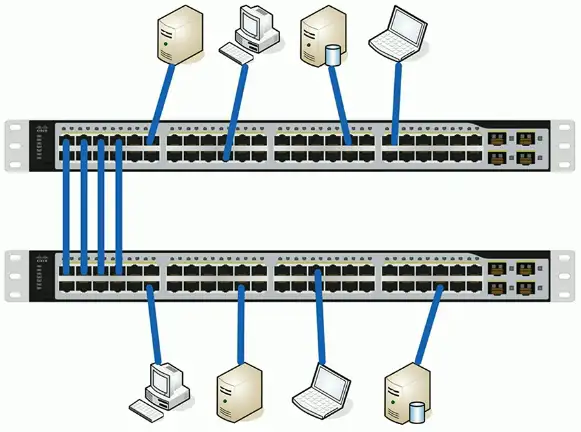
Examine a copy of the traffic
- Port mirror (SPAN), network tap
Network Solutions
Network Discovery
Difficult to see beyond the wall jack
- LLDP (Link Layer Discovery Protocol), CDP (Cisco Discovery Protocol), etc.
- IP scanners (Nmap)
- Commercial network scanners
- SNMP
Ad hoc
- Scan as needed or required
Scheduled
- Scan occurs at regular intervals
- Report on moves, adds, and changes
Traffic Analysis
View traffic information from routers, switches, firewalls, etc.
- Identify traffic flows
- View traffic summaries
Can be very detailed
- Every flow from every device
Important historical information
- Monitoring, post-event analysis
Performance Monitoring
The fundamental network statistic
- Amount of network use over time
Many ways to gather this metric
- SNMP, NetFlow, protocol analysis, software agent
Identify fundamental issues
- Nothing works properly if bandwidth is highly utilized
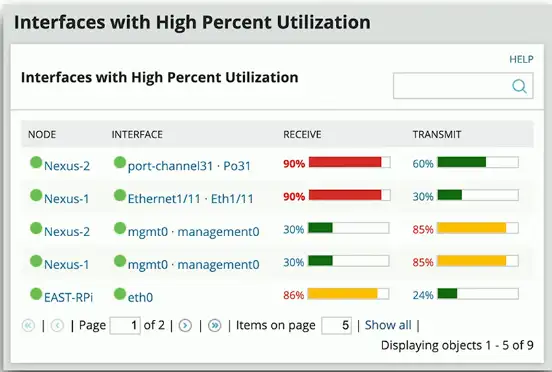
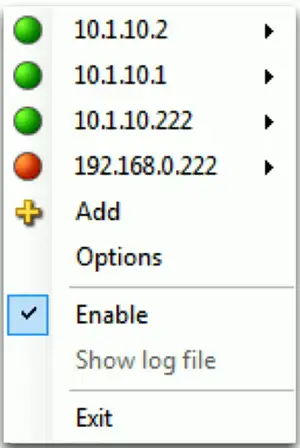
Availability monitoring
Up or down
- The most important statistic
- No special rights or permissions required
- Green is good, red is bad
Alarming and alerting
- Notification should an interface fail to report
- Email, SMS
Short-term and long-term reporting
- View availability over time
Not focused on additional details
- Additional monitoring may require SNMP
Network device backup and restore
Every device has a configuration
- IP addresses, security settings, port configurations
- Most devices allow the configuration to be downloaded and uploaded
- Configurations may be specific to a version of operating code or firmware
Revert to a previous state
- Use backups to return to a previous configuration date and time
- May require a firmware or version downgrade
Configuring monitoring
Ten identical web servers
- Should have ten identical configurations
- How to confirm?
Monitor the configurations
- Verify consistency
- Alert on any changes
- Backup and restore
Often part of a larger management system or strategy
- Central console and access